De pagina ververst bij het selecteren van een onderwerp.
Sla artikel navigatie over.Portfolio - composition
At the end of 2023, the ARC Fund standing portfolio consisted of 11,155 homes with a book value of EUR 3.8 billion. The average book value per home decreased by 6.2%.
Figure 14: Total portfolio by type
Composition by book value
2023
2022
Multi-family homes account for 67% of the portfolio, while single-family homes make up 31% of the portfolio. The committed pipeline includes almost exclusively MFH projects. Approximately 2% of the total investment portfolio value consists of commercial real estate units embedded in residential buildings in the portfolio. The four largest cities in the Netherlands continue to be well represented, accounting for 51% of the portfolio.
Figure 15: Total portfolio by region
Composition by book value
2023
Figure 16: Residential portfolio by rental price
Composition by book value
The ARC Fund's focus remains on the mid-priced segment, which accounts for 77% of the portfolio's rental income. As of 2024, we differentiate between the lower mid-priced segment and the upper mid-priced segment. The lower mid-priced segment includes homes with a monthly rent of EUR 880 to EUR 1,123, and accounts for 32% of the portfolio. The higher mid-priced segment starts at EUR 1,123. The upper limit is dependent on the region and ranges from EUR 1,150 (Remaining Regions) to EUR 1,600 (Amsterdam and Utrecht). The higher mid-prices segment accounts for 45% of the portfolio. See table on page 118 of the annex for a complete overview.
* Please refer to the KPI tables in the Annexes. KPIs include limited assurance by external auditor. A separate assurance report is included on page 85.
Figure 17: Total portfolio by age
At year-end 2023, the weighted average building year of the portfolio was 2012. Most properties (75%) were constructed within the last 15 years. The construction year isn't corrected for renovations. 97% of properties have energy label A or B. To meet 100% alignment with the SFDR standards for Article 8 funds (Light Green), we aim to realise energy label A or B for all assets in the portfolio.
Figure 18: Distribution of energy labels
2023
2022
* Please refer to the KPI tables in the Annexes. KPIs include limited assurance by external auditor. A separate assurance report is included on page 85.
Figure 19: Largest properties/districts
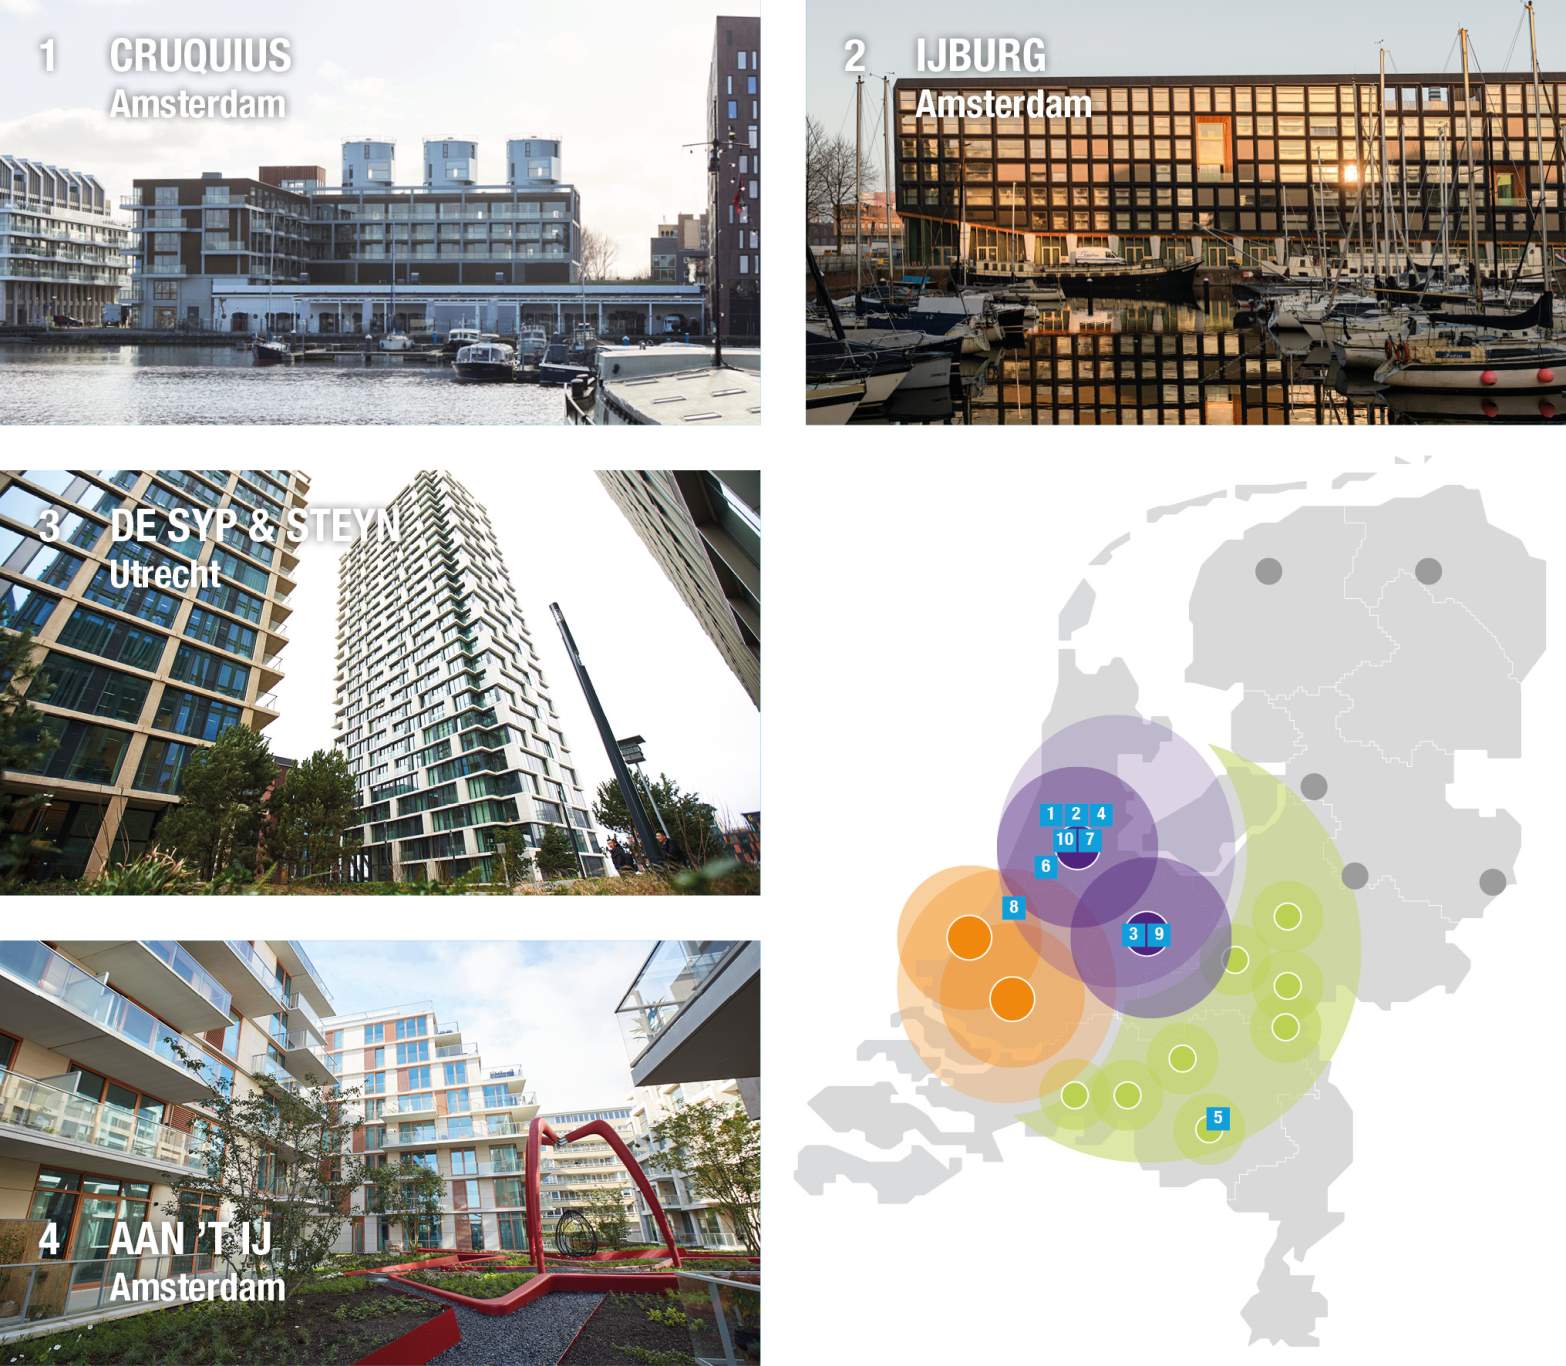
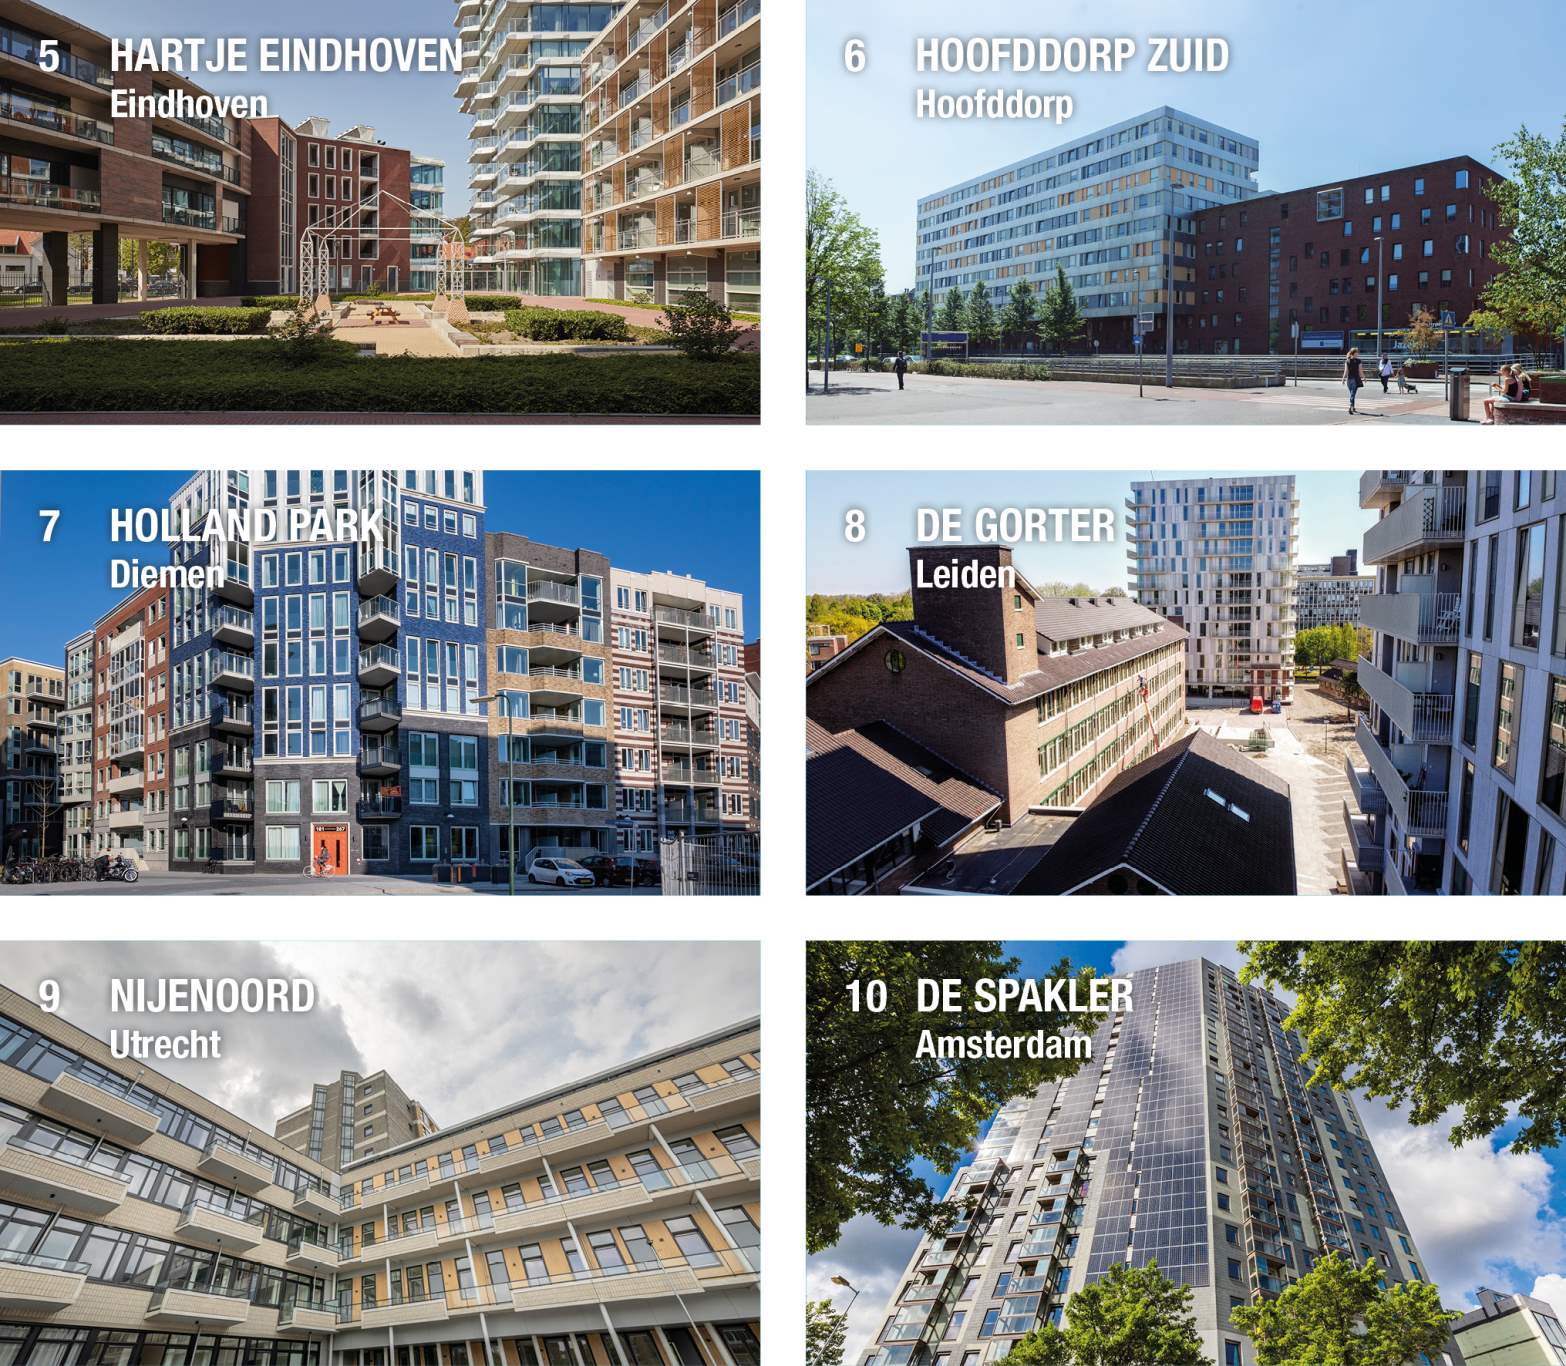
Table 1: The ten properties/districts with the highest operational vacancy rate
City | Name | Number of homes | Operational vacancy relative to total vacancy (%)* | Operational vacancy relative to property theoretical income (%)* |
Utrecht | De Syp & Steyn | 386 | 15.5% | 6.2% |
Amsterdam | Cruquius | 462 | 11.3% | 3.0% |
Amsterdam | 360 Degrees | 122 | 7.8% | 7.3% |
Amsterdam | IJburg | 578 | 6.4% | 1.7% |
Den Haag | New Babylon | 116 | 6.1% | 5.3% |
Amsterdam | Aan 't IJ | 292 | 5.4% | 2.1% |
Utrecht | Nijenoord | 195 | 3.6% | 2.9% |
Diemen | Holland Park | 202 | 2.8% | 1.9% |
Hoofddorp | Hoofddorp Zuid | 336 | 2.4% | 1.2% |
Amsterdam | De Spakler | 160 | 2.2% | 2.0% |
Rotterdam | De Rotterdam | 78 | 2.0% | 2.8% |
*The Vacancy determiniation includes both the vacancy of residential and commercial properties.