Key figures 2024
Figure 3: Distributions & Inrev nav per unit
As % of INREV NAV as at 1 January
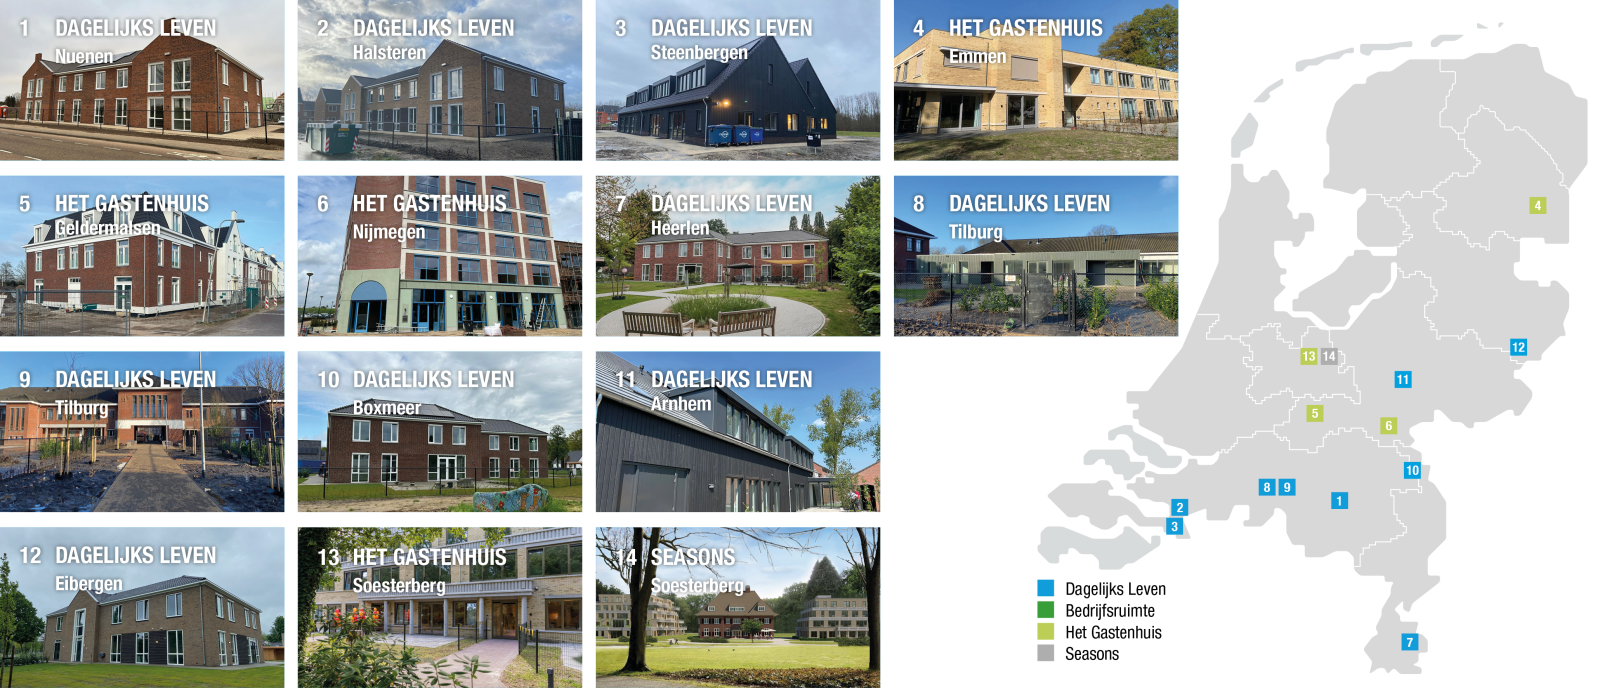
Figure 4: Number of locations per provider
In percentage
Figure 5: Investment property (EUR x Million)
In € million
Figure 6: Quarterly fund return
As % of average INREV GAV
Properties added in 2024