Portfolio - composition
At the end of 2022, the ARC Fund standing portfolio consisted of 11,010 homes with a book value of EUR 4.0 billion. The average book value per home decreased by 0.9%.
Figure 13: Total portfolio by type
Composition by book value
2022
2021
Multi-family homes in the portfolio continue to make up 67% of the portfolio, while single-family homes make up 31% of the portfolio. These numbers have remained stable, despite the ongoing limited availability of single-family homes that meet our investment requirements. The secured pipeline includes almost exclusively multi-family home projects. Approximately 2% of the total investment portfolio value consists of care and commercial real estate units embedded in residential buildings in the portfolio.
Figure 14: Total portfolio by region
Composition by book value
2022
New homes were added in sizeable, newly delivered multi-family residential projects in Amsterdam and Utrecht, while 242 homes were sold in Rotterdam. The share of homes located in the four largest cities in the Netherlands remains at 52%.
Figure 15: Residential portfolio by rental price
Composition by book value
The ARC Fund's focus remains on affordable/attainable homes in the mid-priced private rental sector. The share of mid-priced rental homes in the portfolio has remained stable over the years. In 2022, the segment made up 83% of the portfolio, well above the target allocation of 75%. The mid-priced segment varies by region. On the low side, this segment starts at EUR 808.10 per month and the upper limit ranges from EUR 1,100 per month in the Remaining Regions to EUR 1,550 per month in Amsterdam. See table 1 on page 119 in the annexes.
* Please refer to the KPI tables in the Annexes. KPIs include limited assurance by external auditor. A separate assurance report is included on page 84.
Figure 16: Total portfolio by age
At year end 2022, the weighted average of the portfolio was 11 years. Most properties (78%) were built within the last 15 years. 91% of properties have energy label A or B. The ARC Fund invests in sustainability and quality improvement of assets that meet our return requirement. This includes the installation of solar panels and hybrid heating systems to reduce carbon emissions.
Figure 17: Distribution of energy labels
2022
2021
The portfolio is well diversified in terms of book value per property. As a result of this composition, the performance of individual properties as well as clusters of properties in certain neighbourhoods have had a minimal impact on the overall performance of the portfolio. However, the ten largest properties / districts based on book value together represent 30% of the total portfolio value, which is expected due to our position as an area investor.
* Please refer to the KPI tables in the Annexes. KPIs include limited assurance by external auditor. A separate assurance report is included on page 84.
Figure 18: Largest properties/districts
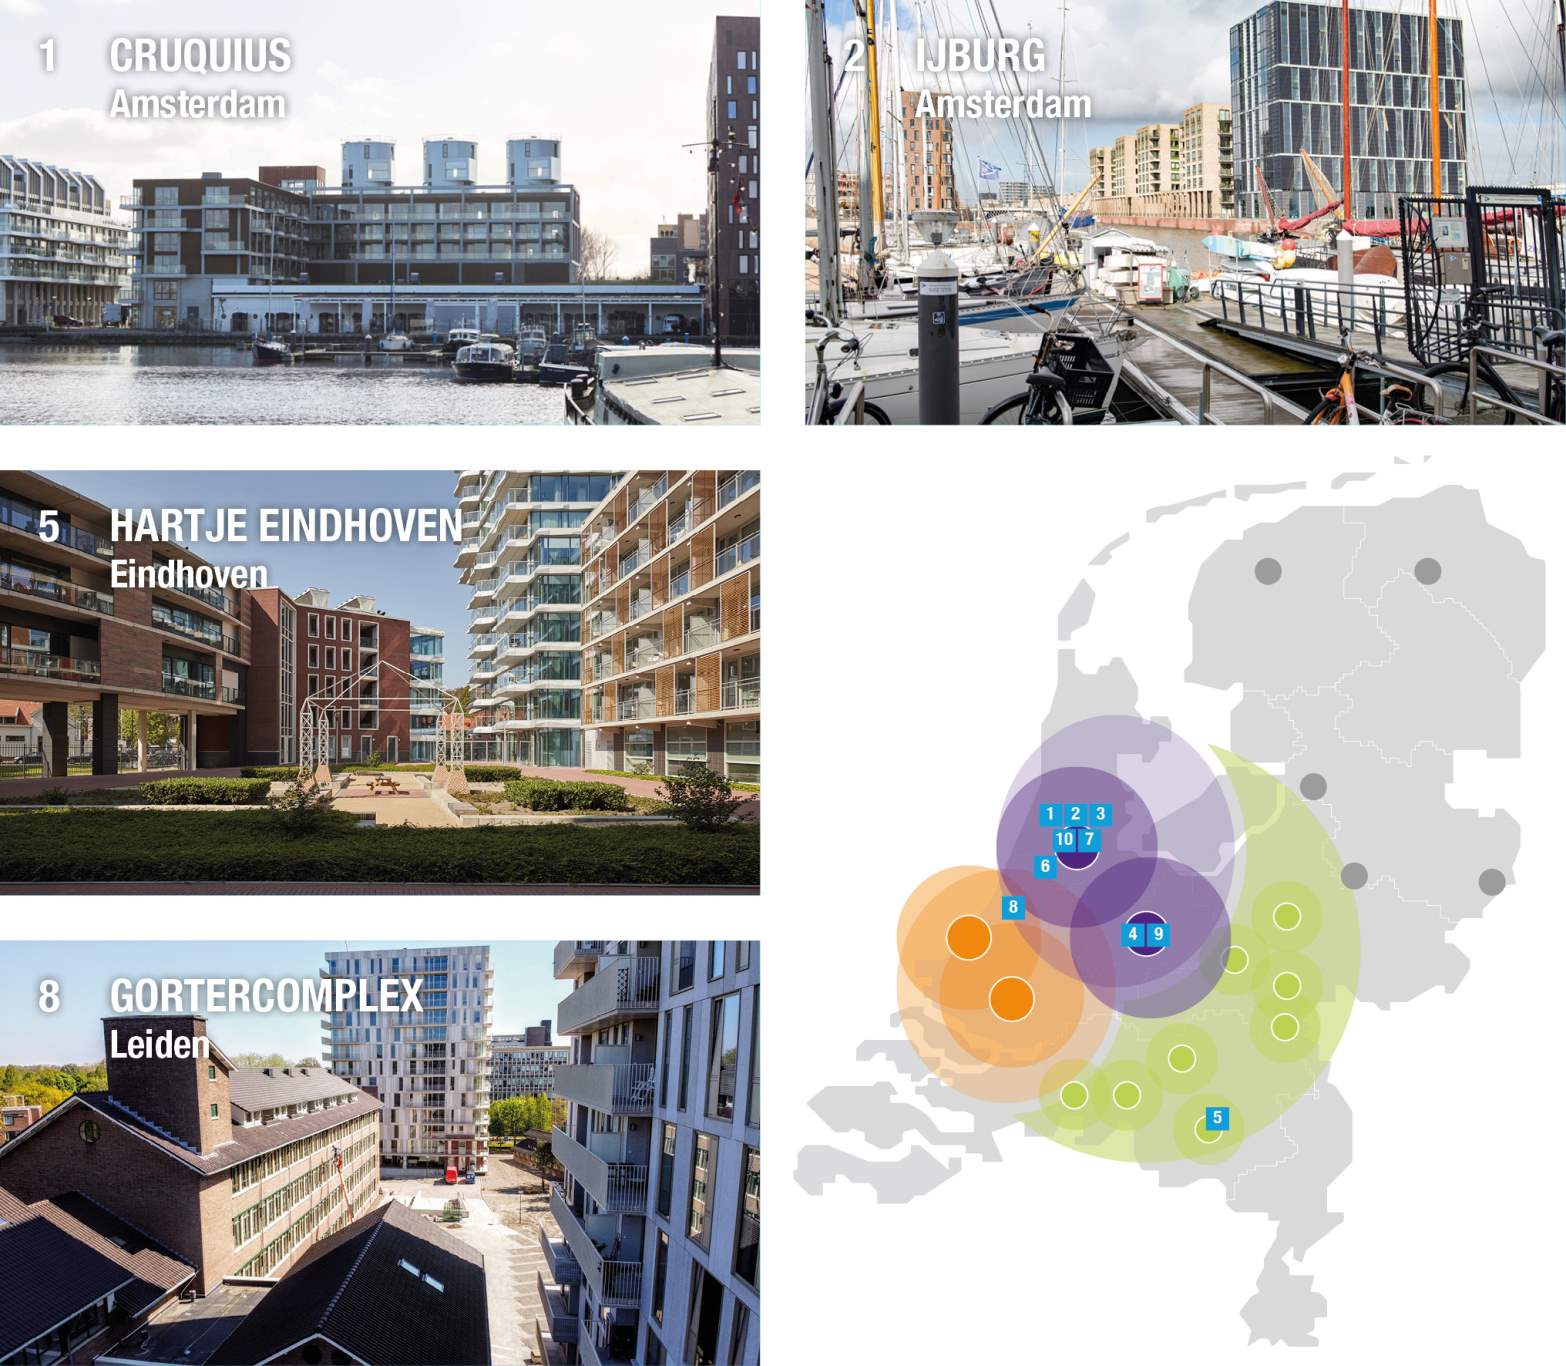
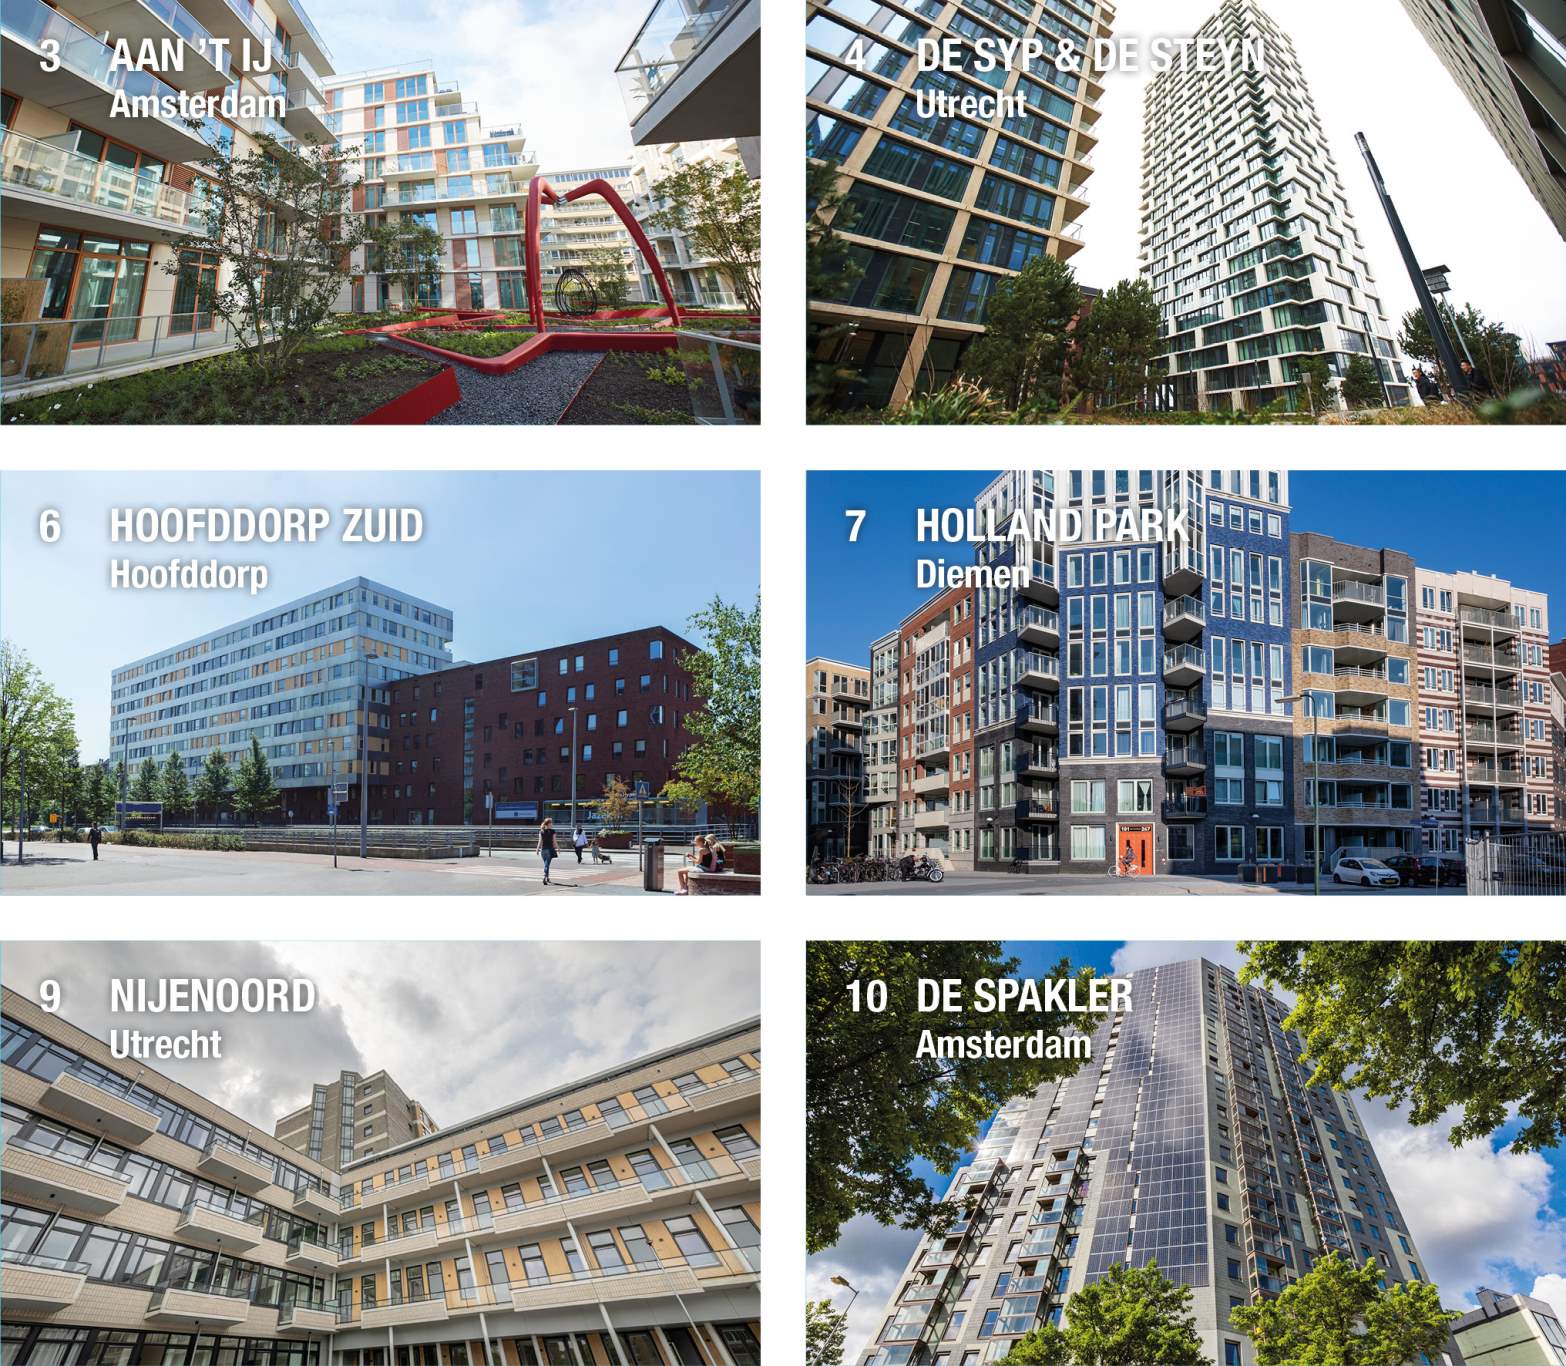
Table 2: The ten properties with the highest vacancy rate
City | Name | Number of homes | Operational vacancy relative to total vacancy (%) | Operational vacancy relative to property |
Amsterdam | Cruquius | 418 | 9.7% | 2.4% |
Amsterdam | Havenmeester/Het IJland | 388 | 6.5% | 2.4% |
Utrecht | De Syp | 266 | 6.3% | 3.7% |
The Hague | New Babylon | 122 | 6.1% | 4.5% |
The Hague | De Sophie | 67 | 5.9% | 10.4% |
Utrecht | Nijenoord | 195 | 4.4% | 3.3% |
Amsterdam | Xavier | 110 | 4.2% | 4.1% |
Diemen | Holland Park | 202 | 3.7% | 2.3% |
Delft | De Groene Haven (Volt) | 130 | 3.5% | 4.0% |
Hoofddorp | Hoofddorp Zuid | 337 | 2.3% | 1.0% |